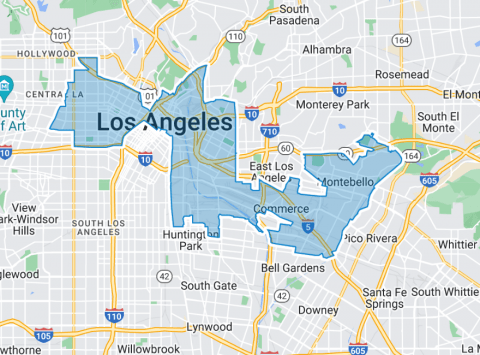
District Information

DISTRICT AD54
2020 Census Population (adj Elec. §21003)
| Name | Count | Percent |
|---|
| Total Population (POP) | 505,678 | 100.00% |
|---|
| POP Hispanic or Latino | 324,353 | 64.14% |
|---|
| POP Not Hispanic or Latino (NH) | 181,325 | 35.86% |
|---|
| POP NH Population of one race | 173,031 | 34.22% |
|---|
| POP NH White alone | 42,854 | 8.47% |
|---|
| POP NH Black or African American alone | 22,536 | 4.46% |
|---|
| POP NH Asian alone | 103,692 | 20.51% |
|---|
| POP NH American Indian and Alaska Native alone | 913 | 0.18% |
|---|
| POP NH Native Hawaiian and Other Pacific Islander alone | 361 | 0.07% |
|---|
| POP NH Some Other Race alone | 2,675 | 0.53% |
|---|
| POP NH Population of two or more races | 8,294 | 1.64% |
|---|
2020 Census Housing Occupancy Status
| Name | Count | Percent |
|---|
| Total Housing Units | 195,172 | 100.00% |
|---|
| Occupied | 182,688 | 93.60% |
|---|
| Vacant | 12,484 | 6.40% |
|---|
2020 Census Group Quarters Population (adj Elec. §21003)
| Name | Count | Percent |
|---|
| Total Group Quarters Population: | 17,769 | 100.00% |
|---|
| Institutionalized population: | 8,853 | 49.82% |
|---|
| Correctional facilities for adults | 5,189 | 29.20% |
|---|
| Juvenile facilities | 264 | 1.49% |
|---|
| Nursing facilities/Skilled-nursing facilities | 3,068 | 17.27% |
|---|
| Other institutional facilities | 332 | 1.87% |
|---|
| Noninstitutionalized population: | 8,916 | 50.18% |
|---|
| College/University student housing | 1,324 | 7.45% |
|---|
| Military quarters | 0 | 0.00% |
|---|
| Other noninstitutional facilities | 7,592 | 42.73% |
|---|
Counties In District
| Name | Count | Percent |
|---|
| Los Angeles | 505,682 | 5.03% |
|---|
Places In District
| Name | Count | Percent |
|---|
| LOS ANGELES: Commerce(C) | 12,445 | 100.00% |
|---|
| LOS ANGELES: Los Angeles(C) | 430,132 | 10.99% |
|---|
| LOS ANGELES: Montebello(C) | 62,879 | 100.00% |
|---|
| LOS ANGELES: Vernon(C) | 226 | 100.00% |
|---|
| LOS ANGELES: Remainder of Los Angeles(R) | 0 | 0.00% |
|---|


